Revenue intelligence · built by an operator
See exactly where you are, and plot your path to growth.
RevPhos turns your scattered sources into one live picture of your revenue — the exact metrics that move your business, on dashboards built for how you actually run it — whatever your industry, built to your definitions.
One platform, three parts
Win the work. Run the work. See the work.
The opportunity
Your numbers already exist. See them all together.
Sales, margin and the order book come together in one live picture, so you can act the moment it matters.
CONNECTED
Every source in one place
ERP, CRM, spreadsheets and inboxes become one source of truth, so everyone works from the same number.
LIVE
Reports that build themselves
Live numbers that show what is happening right now, ready whenever you need them.
SHARED
From one spreadsheet to the whole team
Turn the files one person owns into live dashboards your whole team works from.
Across the silos
Your ERP stores it. RevPhos lets every team see it.
Sales sees the stock. Executives see the pipeline beside the order book. Finance gets a cash forecast that builds itself.
Sales sees Stock and pricing
Quote with the stock in front of you.
Quick Quote puts price, stock on hand, stock on order and stock age on one screen. The seller quotes what can actually ship, and moves ageing stock while it still has value.
Executives sees Pipeline and the order book
See what is coming, and what is sold but not yet delivered.
The open pipeline sits beside the order book: deals still being won next to orders already won and waiting to ship. Together they show next quarter's revenue, and how much new business you still need.
Sales sees Purchasing
Promise a date you can keep.
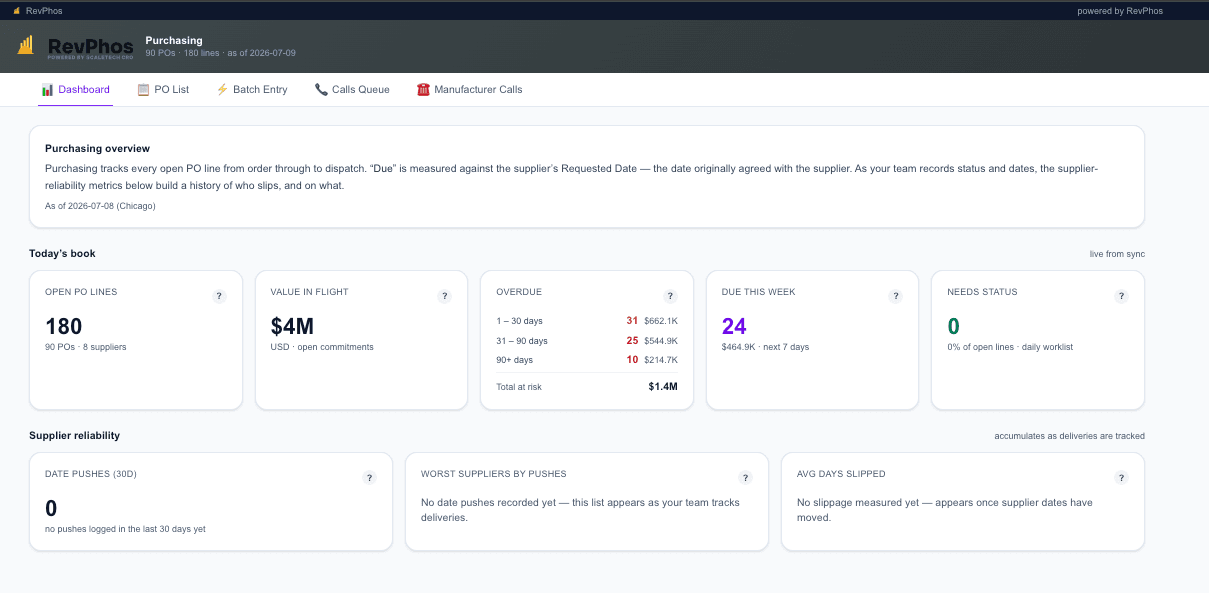
Before quoting a lead time, the seller sees whether the supplier order is late. Purchasing sees which customer orders each late PO puts at risk, and chases those first.
RevPhos remembers
Your CRM shows today. RevPhos remembers every day.
Your CRM and ERP overwrite yesterday every time something changes, so “what did the pipeline look like last month?” has no answer. RevPhos saves a copy as it goes, so you can see the trend, not just the total.
EVERY WEEK
The pipeline, as it stood
A full copy of the pipeline every week. See what moved, slipped, stalled, arrived or disappeared, and whether the pipeline is growing.
EVERY DAY
The order book, as it stood
The order book saved daily. Pick any past day and see exactly what was booked, so a slipped or cancelled order never just vanishes.
EVERY FORECAST
The cash outlook, version by version
Every cash forecast is kept, so you can see how the outlook moved from one week to the next, and why.
EVERY CALL
Each forecast against what closed
Each rep's forecast is saved and scored against what actually closed. Over time you learn whose number to trust.
One operator's build, made for one business
The metrics that actually move growth — live.
The handful of views a leader checks to know exactly where the business stands, and what to do next.
These four screens were built for one company — to their metrics, their definitions, the way they actually run. Yours would be built around you. That's the point.
Results →
Where your true margin is, and where to protect it.
Forward Revenue →
The order book ahead of you, by month — revenue you can already see.
Beat the AI →
Every rep's forecast scored against the model — accountability made visible.
AI, in every screen we build
Ask your data anything. Walk out with the answer — and the deck.
An operator's intelligence sits inside every screen. Ask a question in plain language, get a straight answer and a recommended move, then export a finished report without leaving the page.
Ask in plain language
Any question about your own numbers, answered specifically and in seconds.
Get the next move
Beyond what happened: a recommended direction, grounded in your own data.
Export in one click
Turn any view into a finished report in PowerPoint, Word or Excel — board-ready in seconds.

Built by an operator
Built by a revenue leader who sat in the chair.
RevPhos was built by a chief revenue officer who has carried the number, and who knows exactly which few metrics change the direction of a company.
The data I spent a career wishing for — running revenue teams inside billion-dollar companies — used to take a data team and a budget to match. Technology finally caught up. Now that same clarity is within reach of a business your size.
That's the difference. You get the instincts of an operator, wired into a live platform that never sleeps.
We build what you need to see
Your business is specific. Your dashboards should be too.
We build the exact views your business runs on — from a single scorecard to a full operating cockpit — bespoke on the surface, one connected engine underneath. Role-based access gives everyone exactly the view they need.
Built for your metrics
Whatever a growing business needs to watch, we build it — to your own definitions.
Fully connected
Every source unified into one source of truth — so the number is the number, everywhere.
Live in weeks
A real platform already runs underneath. You get a working view in weeks.
See it live
Walk through the real thing.
A fully seeded, live demo of the platform: the actual product, running on real-shaped data. Have a look around.
In the field
"For the first time, the whole team is looking at the same numbers — and acting on them the same day."
Live deployment · industrial distribution · full reference on request